D7 Patient Care Tracking Report
Here's how to access the D7 Patient Care Tracking report:
- Go to Matrix > D7 Patient Care Tracking.
- The default task is Status, Phase & Method.
- From the task menu, select the task you wish to display.

- Near Treatment Finish Zone means patients in this category are within 3 months of the minimum Treatment Length.
- In Treatment Finish Zone means patients are within the min/max Treatment Length time frame.
- Extended Treatment means patients are over maximum Treatment Length.
- Too Many Retention Visits means patients have had more than 3 retention visits
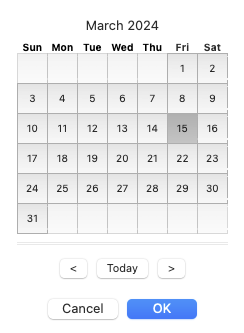
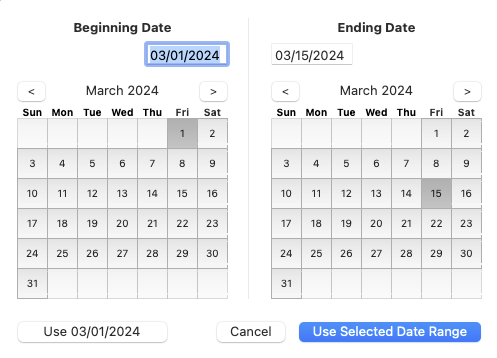
You can view Case Starts (All Phases), Case Starts (Non-Phase 2), and Case Finishes, and filter D7 info by Date or Date Range in the task menu. The default date/date range is month to date.
- From the D7 Matrix, click the task menu.

- Next, choose the task menu item you’d like to view. You’ll select the date or date range as indicated in the screenshots below:

Pro tip: Use the Shortcut Command F to find a patient easy peasy!
- From the list, click the disclosing triangles (on the left side of the list) to open up each level and display more information.
- To quickly open all levels in a group, hold down the option key and press the uppermost disclosing triangle. Click it again to close the levels.

- Missing Statuses are displayed at the top of the list in red.
- To filter the list by Doctor, Tx Coordinator, or Location, choose from the pop-up menu.

- To open a patient’s chart from the list, double click their name to jump directly to their Treatment Notes.
- You can also move directly to a specific area in the patient’s chart. Click the patient’s name to display a contextual menu and chose where you want to go.

- If you would like to reorganize the list, click the column headers to sort, or drag & drop columns. You can select a group of patients (click and drag along your selection) or select specific patients (hold the command key and click individual rows) to get totals and averages. There’s a lot to see and do in the D7 Matrix! Scroll to the right to see more columns.

- Spend some time in D7 Patient Care Tracking! Go ahead and open up the various tasks, view all the columns, and play around. You’ll be surprised at how much information you can find. It will probably take a full patient cycle (weekly interval in which you see patients) for D7 Patient Care Tracking analytics to truly display your office’s statistics.
🍿 Watch a Video